Example 2: Data Fusion
The following example illustrates the fusion of data from disparate sources to form a global model.
Two data sets are used.
A zonal response surface is created for each data set independently.
The zonal representations are subsequently "fused" using fuzzy logic.
The data sets consist of fictional experimental and numerical data points in three dimensions (independent variables "var1," "var2," and "var3").
The independent variables (horizontal axes) shown in the figures are var1 and var2.
Thus, each plot is for a fixed value (projection) of the variable var3.
Although the independent variables var1 and var2 used in each zone overlap, their ranges do not coincide.
In addition, the uncertainty specified for the "experimental" data set (variable "dq" in the rsd file below) is roughly 3 times that specified for the numerical data.
One data set (the experimental data set (left)) experiences the values var3=12 and var3=10.5.
The other data set (the numerical data set (right)) contains data at var3=12 and var3=14.
The two data sets are fused with user-defined membership functions which govern how the variables are weighted in the regions of data overlap.
DEPENDENT
= "q"
UNCERTAINTY = "dq"
INDEPENDENT = "var1", "var2", "var3"
RESOLUTION
= "0.01", "0.01", "0.00"
VARIABLES
= "var1", "var2", "var3", "q", "dq"
ZONE T="First Data Set (Experiment)"
0.1
0.2
12.0
1
0.1
0.1
1.2
12.0
1.8
0.15
0.3
0.4
12.0
1.25
0.15
0.3
0.4
10.5
1.15
0.15
ZONE T="Second Data Set (Analysis)"
0.2
0.5
12.0
1.4
0.05
0.2
1.0
12.0
1.75
0.05
1.0
0.5
12.0
1.6
0.05
1.0
1.3
12.0
2.45
0.05
0.6
0.75
14.0
1.95
0.05
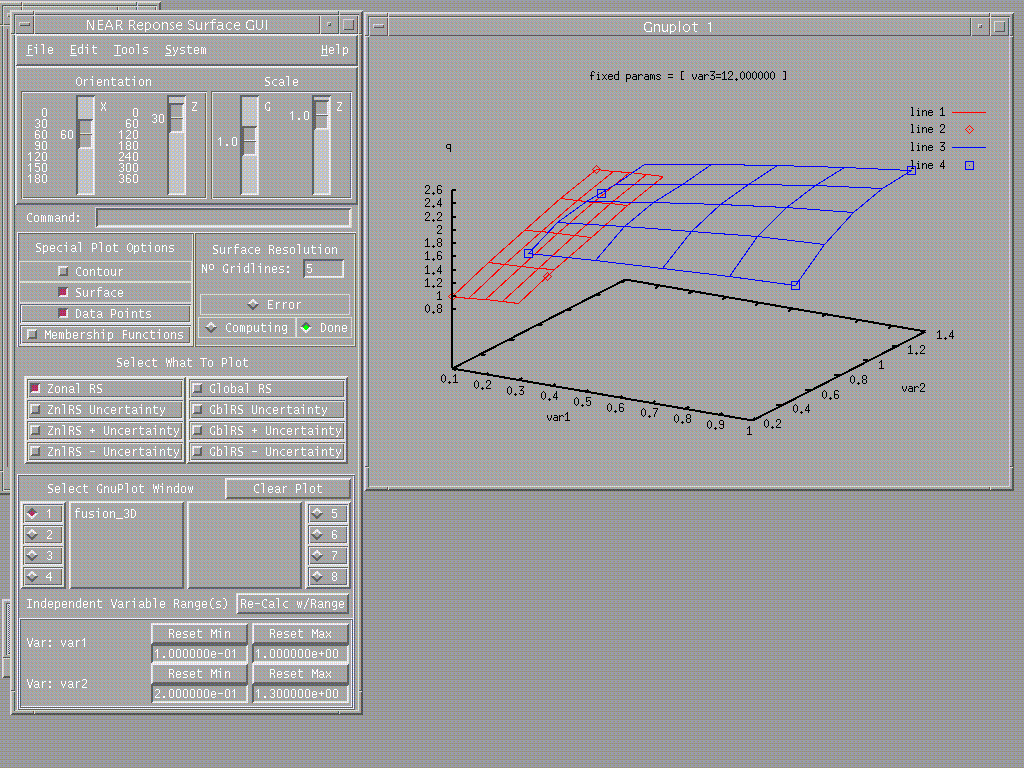
Shown below are the two zonal response surfaces in the form of wiremesh plots, experimental (red) and analytical (blue).
Supporting data points, when present for the given value of the var3 projection, are indicated as symbols.
By definition, zonal response surfaces are not affected by data in other zones.

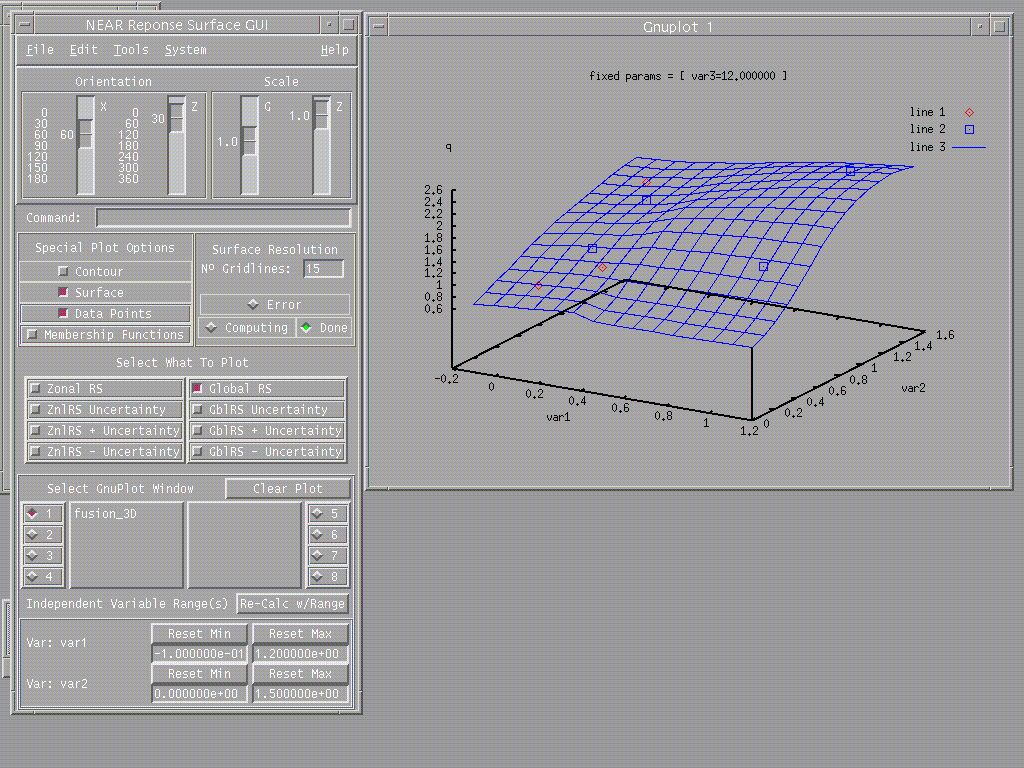
The global response surface is now shown (blue).
This surface is shown with
a value of "var3" equal to 12.0 which is the most probable value of var3 found in the database.

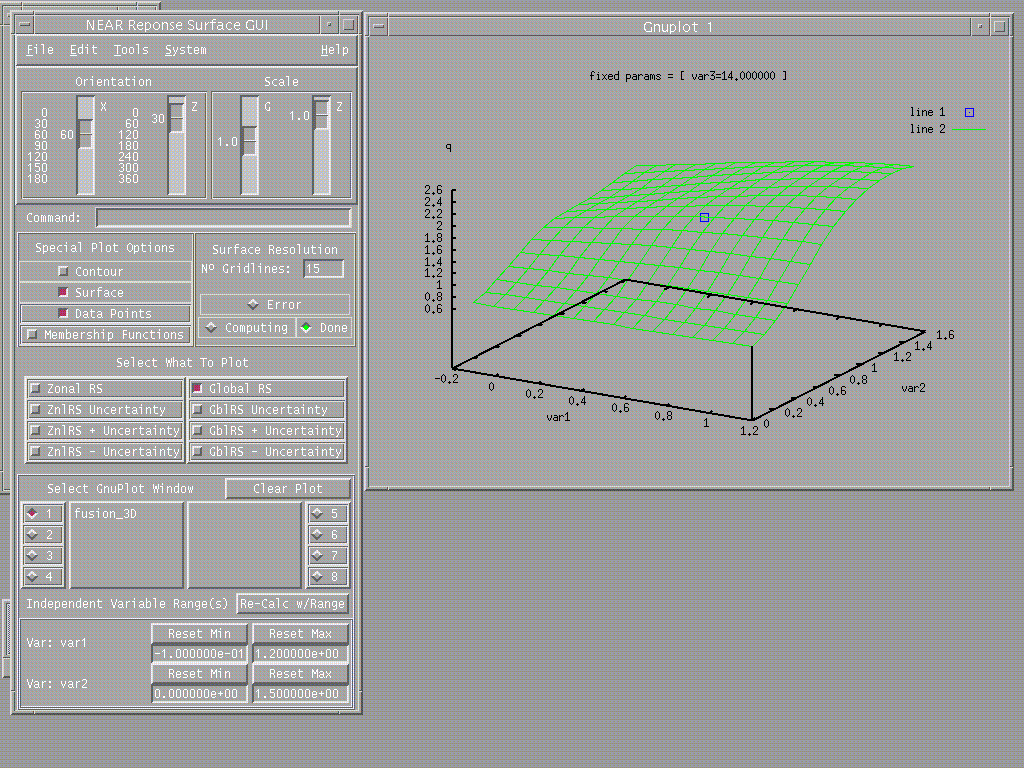
The global response surface shown below is an extrapolation in terms of the third variable ("var3").
While there is only one "numerical" point for this value of var3 (var3=14), it is clear that the surface inherits the trends/curvature imposed by the points located in other planes.

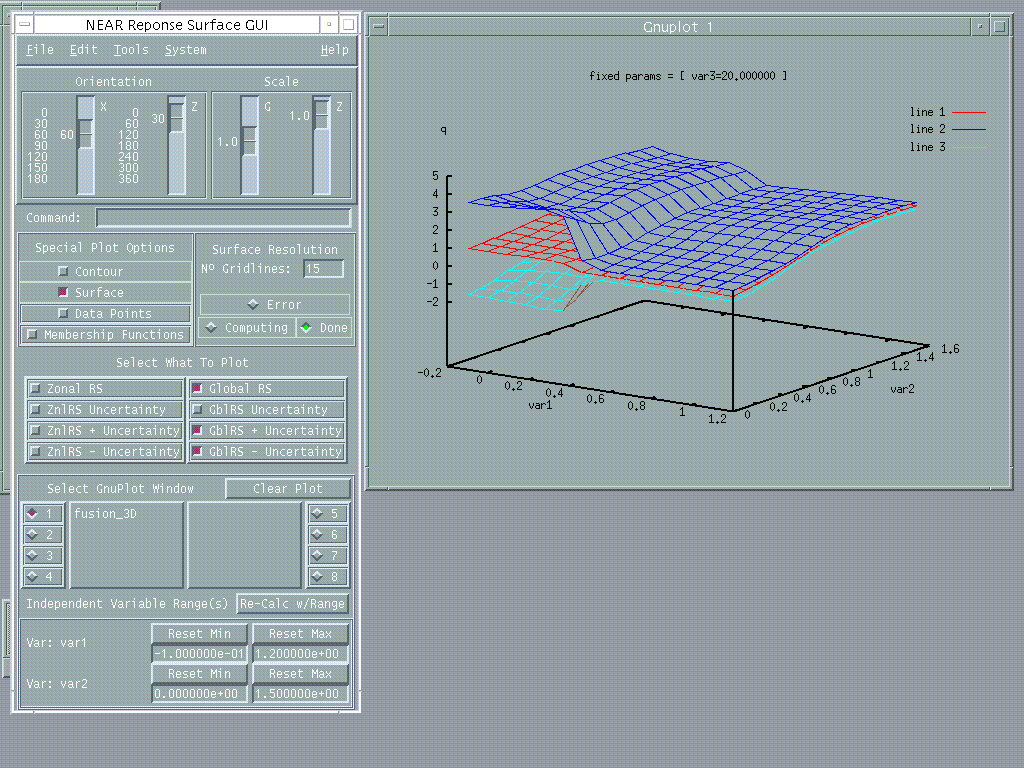
Extrapolating further to var3=20 produces the response surface seen below, where the global analytical prediction is shown (red), plus (blue) and minus (cyan) uncertainty.
Note the "blooming" of the uncertainty away from the data points (var3=20, versus the data range [10.5,14]), particularly for values of var1 and var2 corresponding to the experimental data.
This automatic propagation of uncertainty through the response surface construction process is the result of covariance analysis.
The results convey two important pieces of information:
(1) the confidence in the prediction diminishes as one moves away from the true (supporting) data, and (2) the confidence is less for the range of (var1,var2) where the influence of the experimental data set is dominant, due to the higher data uncertainty in this region.


