Example 1:Multidimensional Modeling / Sparse Data Sets
The following example shows how an 11-dimensional response surface
evolves as data points are progressively added.
The 11 independent variables are named "t1" through "t11."
The 2 dependent variables are named "Q1" and "Q2". In the figures that follow, the variables chosen for plotting are "t6" and "t9"
for the Independent (horizontal) axes
and "Q1" for the Dependent (vertical) axis.
The data used in this example are fictional and do not represent anything physical. In each case, the input data (rsd format) is shown for comparison.
Single-point example in rsd format:
DEPENDENT
= "Q1" , "Q2"
UNCERTAINTY = "0.1", "0.2"
INDEPENDENT = "t1", "t2", "t3", "t4", "t5", "t6", "t7", "t8", "t9", "t10", "t11"
RESOLUTION
= ".0", ".0", ".0", ".0", ".0", ".0", ".0", ".0", ".0", ".0", ".0"
VARIABLES
= "Q1", "Q2", "t1", "t2", "t3", "t4", "t5", "t6", "t7", "t8", "t9", "t10", "t11"
ZONE T="Zone 1"
1.0 1.0 0.0 0.0 0.0 0.0 0.0 0.0 0.0 0.0 0.0 0.0 0.0
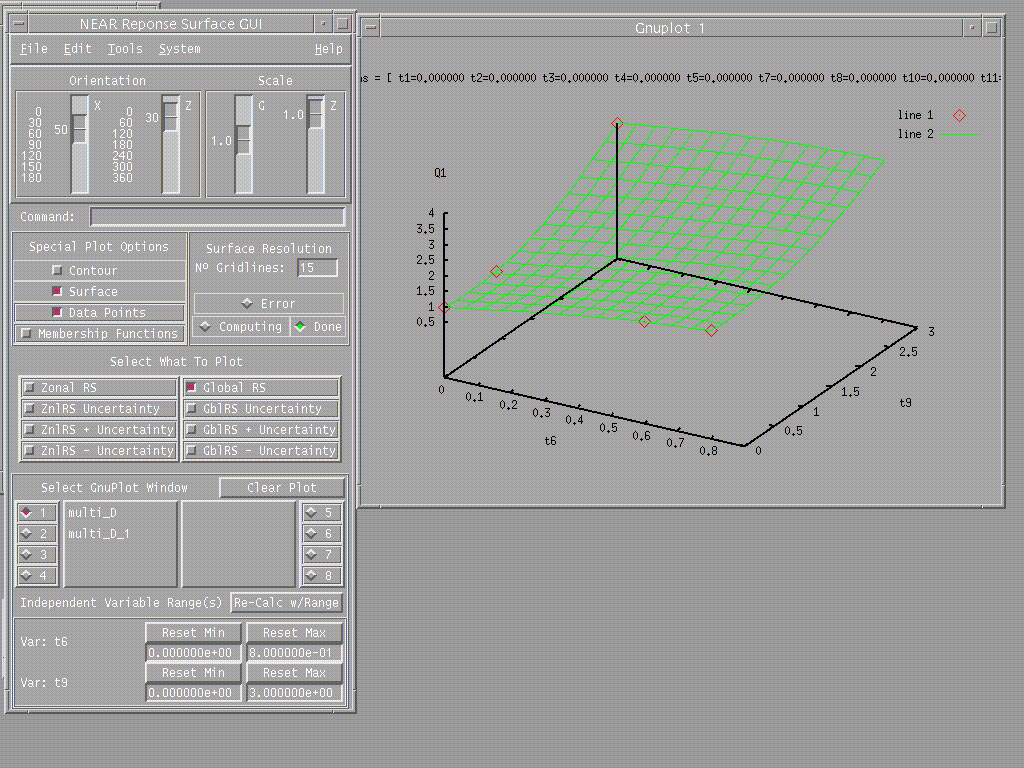
This degenerate case contains a single data point (shown as a red symbol). The resulting response surface (indicated by the green wiremesh) is nearly flat (note the scale on the vertical axis).
Two-point example in rsd format:
DEPENDENT
= "Q1" , "Q2"
UNCERTAINTY = "0.1", "0.2"
INDEPENDENT = "t1", "t2", "t3", "t4", "t5", "t6", "t7", "t8", "t9", "t10", "t11"
RESOLUTION
= ".0", ".0", ".0", ".0", ".0", ".0", ".0", ".0", ".0", ".0", ".0"
VARIABLES
= "Q1", "Q2", "t1", "t2", "t3", "t4", "t5", "t6", "t7", "t8", "t9", "t10", "t11"
ZONE T="Zone 1"
1.0 1.0 0.0 0.0 0.0 0.0 0.0 0.0 0.0 0.0 0.0 0.0 0.0
2.2 1.2 0.0 0.0 0.0 0.0 0.0 0.8 0.0 0.0 0.0 0.0 0.0
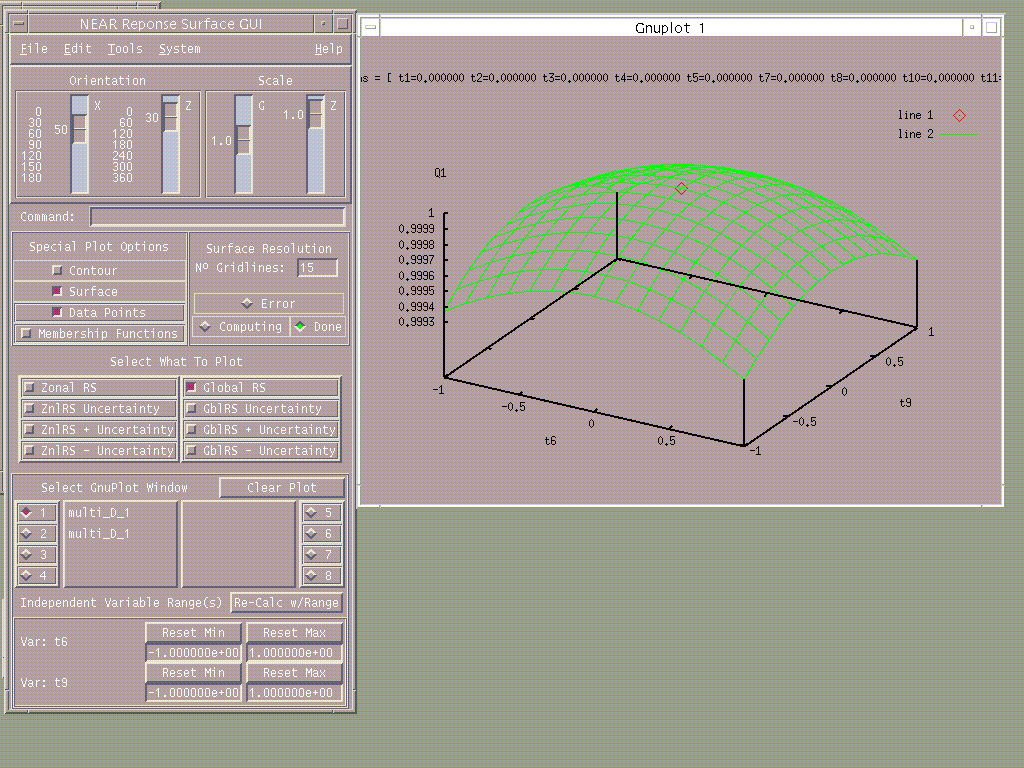
As soon as a second data point is added, the response surface adjusts to the new piece of information (a gradient with respect to the "t6" variable), resulting in a nearly planar approximation.
Three-point example in rsd format:
DEPENDENT
= "Q1" , "Q2"
UNCERTAINTY = "0.1", "0.2"
INDEPENDENT = "t1", "t2", "t3", "t4", "t5", "t6", "t7", "t8", "t9", "t10", "t11"
RESOLUTION
= ".0", ".0", ".0", ".0", ".0", ".0", ".0", ".0", ".0", ".0", ".0"
VARIABLES
= "Q1", "Q2", "t1", "t2", "t3", "t4", "t5", "t6", "t7", "t8", "t9", "t10", "t11"
ZONE T="Zone 1"
1.0 1.0 0.0 0.0 0.0 0.0 0.0 0.0 0.0 0.0 0.0 0.0 0.0
2.2 1.2 0.0 0.0 0.0 0.0 0.0 0.8 0.0 0.0 0.0 0.0 0.0
3.1 2.0 0.0 0.0 0.0 0.0 0.0 0.0 0.0 0.0 3.0 0.0 0.0
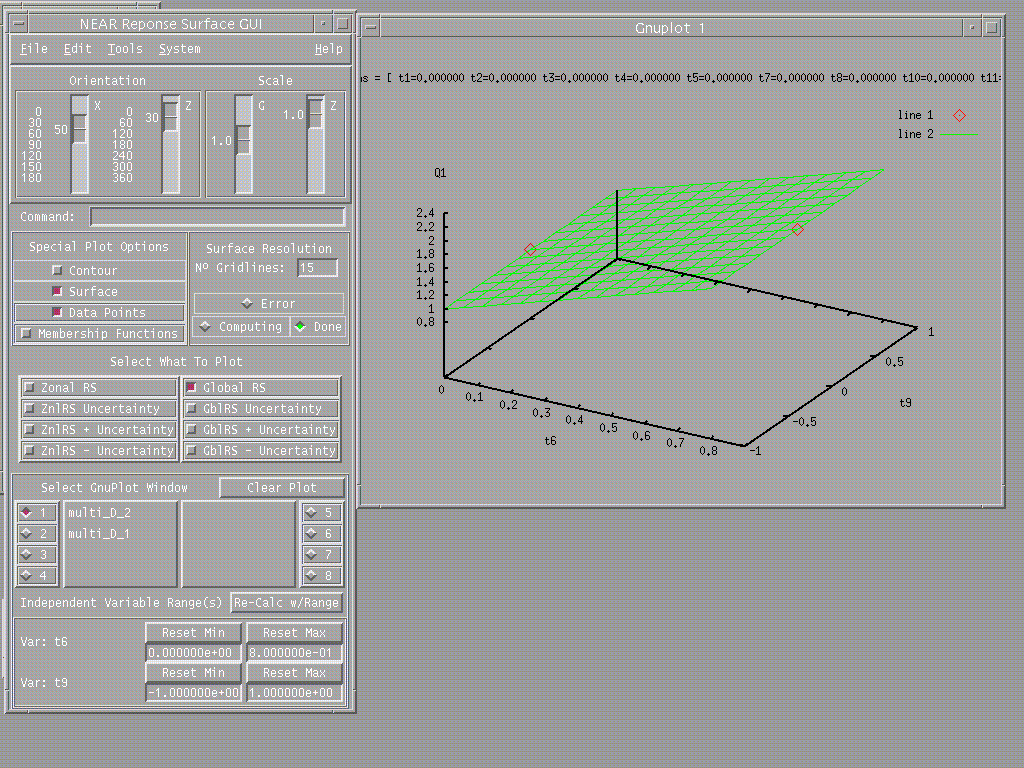
As a third data point is added, the plane tilts, taking into account the new gradient information in the variable "t9".
Five-point example in rsd format:
DEPENDENT
= "Q1" , "Q2"
UNCERTAINTY = "0.1", "0.2"
INDEPENDENT = "t1", "t2", "t3", "t4", "t5", "t6", "t7", "t8", "t9", "t10", "t11"
RESOLUTION
= ".0", ".0", ".0", ".0", ".0", ".0", ".0", ".0", ".0", ".0", ".0"
VARIABLES
= "Q1", "Q2", "t1", "t2", "t3", "t4", "t5", "t6", "t7", "t8", "t9", "t10", "t11"
ZONE T="Zone 1"
1.0 1.0 0.0 0.0 0.0 0.0 0.0 0.0 0.0 0.0 0.0 0.0 0.0
2.2 1.2 0.0 0.0 0.0 0.0 0.0 0.8 0.0 0.0 0.0 0.0 0.0
3.1 2.0 0.0 0.0 0.0 0.0 0.0 0.0 0.0 0.0 3.0 0.0 0.0
1.0 3.0 0.0 0.0 0.0 0.0 0.0 0.0 0.0 0.0 0.9 0.0 0.0
0.7 1.4 0.0 0.0 0.0 0.0 0.0 0.0 0.0 0.0 0.0 0.0 0.1
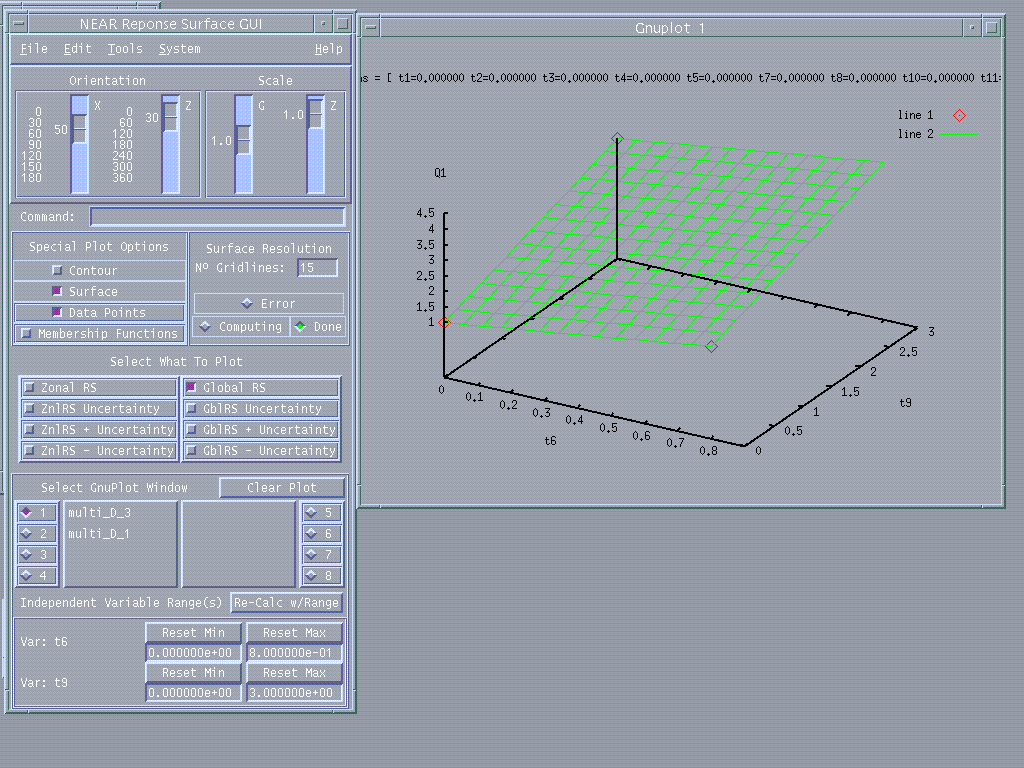
As further points are added, the surface acquires curvature, while also acquiring gradient information (not shown) in the "t11" direction.
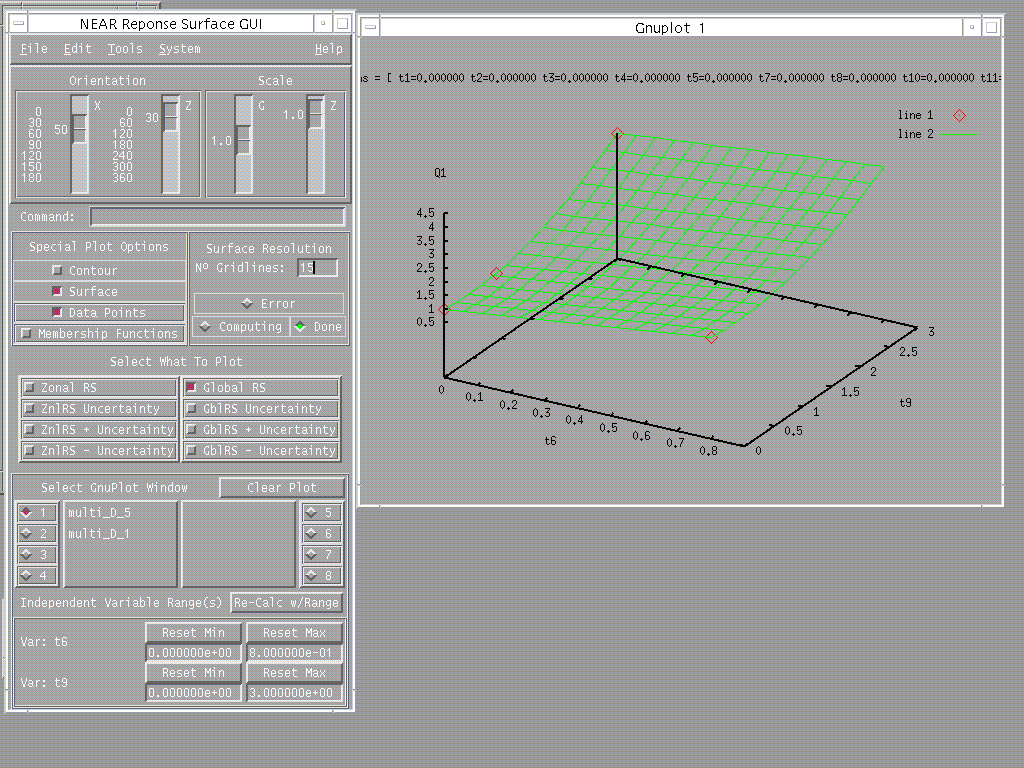
Final data set (22-point example) in rsd format:
DEPENDENT
= "Q1" , "Q2"
UNCERTAINTY = "0.1", "0.2"
INDEPENDENT = "t1", "t2", "t3", "t4", "t5", "t6", "t7", "t8", "t9", "t10", "t11"
RESOLUTION
= ".0", ".0", ".0", ".0", ".0", ".0", ".0", ".0", ".0", ".0", ".0"
VARIABLES
= "Q1", "Q2", "t1", "t2", "t3", "t4", "t5", "t6", "t7", "t8", "t9", "t10", "t11"
ZONE T="Zone 1"
1.0 1.0 0.0 0.0 0.0 0.0 0.0 0.0 0.0 0.0 0.0 0.0 0.0
1.0 1.0 1.0 0.0 0.0 0.0 0.0 0.0 0.0 0.0 0.0 0.0 0.0
1.0 0.9 0.5 0.0 0.0 0.0 0.0 0.0 0.0 0.0 0.0 0.0 0.0
1.1 1.2 0.0 -.2 0.0 0.0 0.0 0.0 0.0 0.0 0.0 0.0 0.0
1.2 1.1 0.0 1.2 0.0 0.0 0.0 0.0 0.0 0.0 0.0 0.0 0.0
0.9 1.2 0.0 0.0 3.0 0.0 0.0 0.0 0.0 0.0 0.0 0.0 0.0
0.5 1.4 0.0 0.0 3.0 1.0 0.0 0.0 0.0 0.0 0.0 0.0 0.0
0.4 1.5 0.0 0.0 0.0 0.7 0.0 0.0 0.0 0.0 0.0 0.0 0.0
1.3 1.9 0.0 0.0 0.0 0.0 -2. 0.0 0.0 0.0 0.0 0.0 0.0
1.9 2.0 0.0 0.0 0.0 0.0 -.5 0.0 0.0 0.0 0.0 0.0 0.0
2.0 1.0 0.0 0.0 0.0 0.0 0.0 0.6 0.0 0.0 0.0 0.0 0.0
2.2 1.2 0.0 0.0 0.0 0.0 0.0 0.8 0.0 0.0 0.0 0.0 0.0
0.3 1.2 0.0 0.0 0.0 0.0 0.0 0.0 -.3 0.0 0.0 0.0 0.0
0.2 1.3 0.0 0.0 0.0 0.0 0.0 0.0 0.1 0.0 0.0 0.0 0.0
0.0 1.0 0.0 0.0 0.0 0.0 0.0 0.0 0.0 0.2 0.0 0.0 0.0
-.5 1.0 0.0 0.0 0.0 0.0 0.0 0.0 0.0 2.0 0.0 0.0 0.0
1.0 3.0 0.0 0.0 0.0 0.0 0.0 0.0 0.0 0.0 0.9 0.0 0.0
3.1 2.0 0.0 0.0 0.0 0.0 0.0 0.0 0.0 0.0 3.0 0.0 0.0
1.5 1.0 0.0 0.0 0.0 0.0 0.0 0.0 0.0 0.0 0.0 -.4 0.0
1.2 1.7 0.0 0.0 0.0 0.0 0.0 0.0 0.0 0.0 0.0 0.0 -.1
0.7 1.4 0.0 0.0 0.0 0.0 0.0 0.0 0.0 0.0 0.0 0.0 0.1
0.4 0.9 0.0 0.0 0.0 0.0 0.0 0.0 0.0 0.0 0.0 0.0 0.2
The final surface displays complex curvature associated with the many "out-of-plane" points not visible in this projection of the 11-dimensional space.
